The Bronx has the highest rates of asthma in New York State. People living in the Bronx are exposed to many risk factors for asthma, including substandard housing and environmental pollution from freeways and factories. I wanted to see how much higher the asthma rates in the Bronx are relative to other counties in New York state.
To do this, I used data from the New York State Department of Health that describes the frequency of asthma-related ER visits between 2005-14.
library(here)
library(tidyverse)
library(readxl)
library(janitor)
library(rvest)
library(ggthemes)
theme_set(theme_economist()) # plots in the style of the Economist magazine
Download the asthma ER data
The asthma data tables were available 1 each per county across the years 2005-2014. Here’s an example of the data table from Albany County, NY:
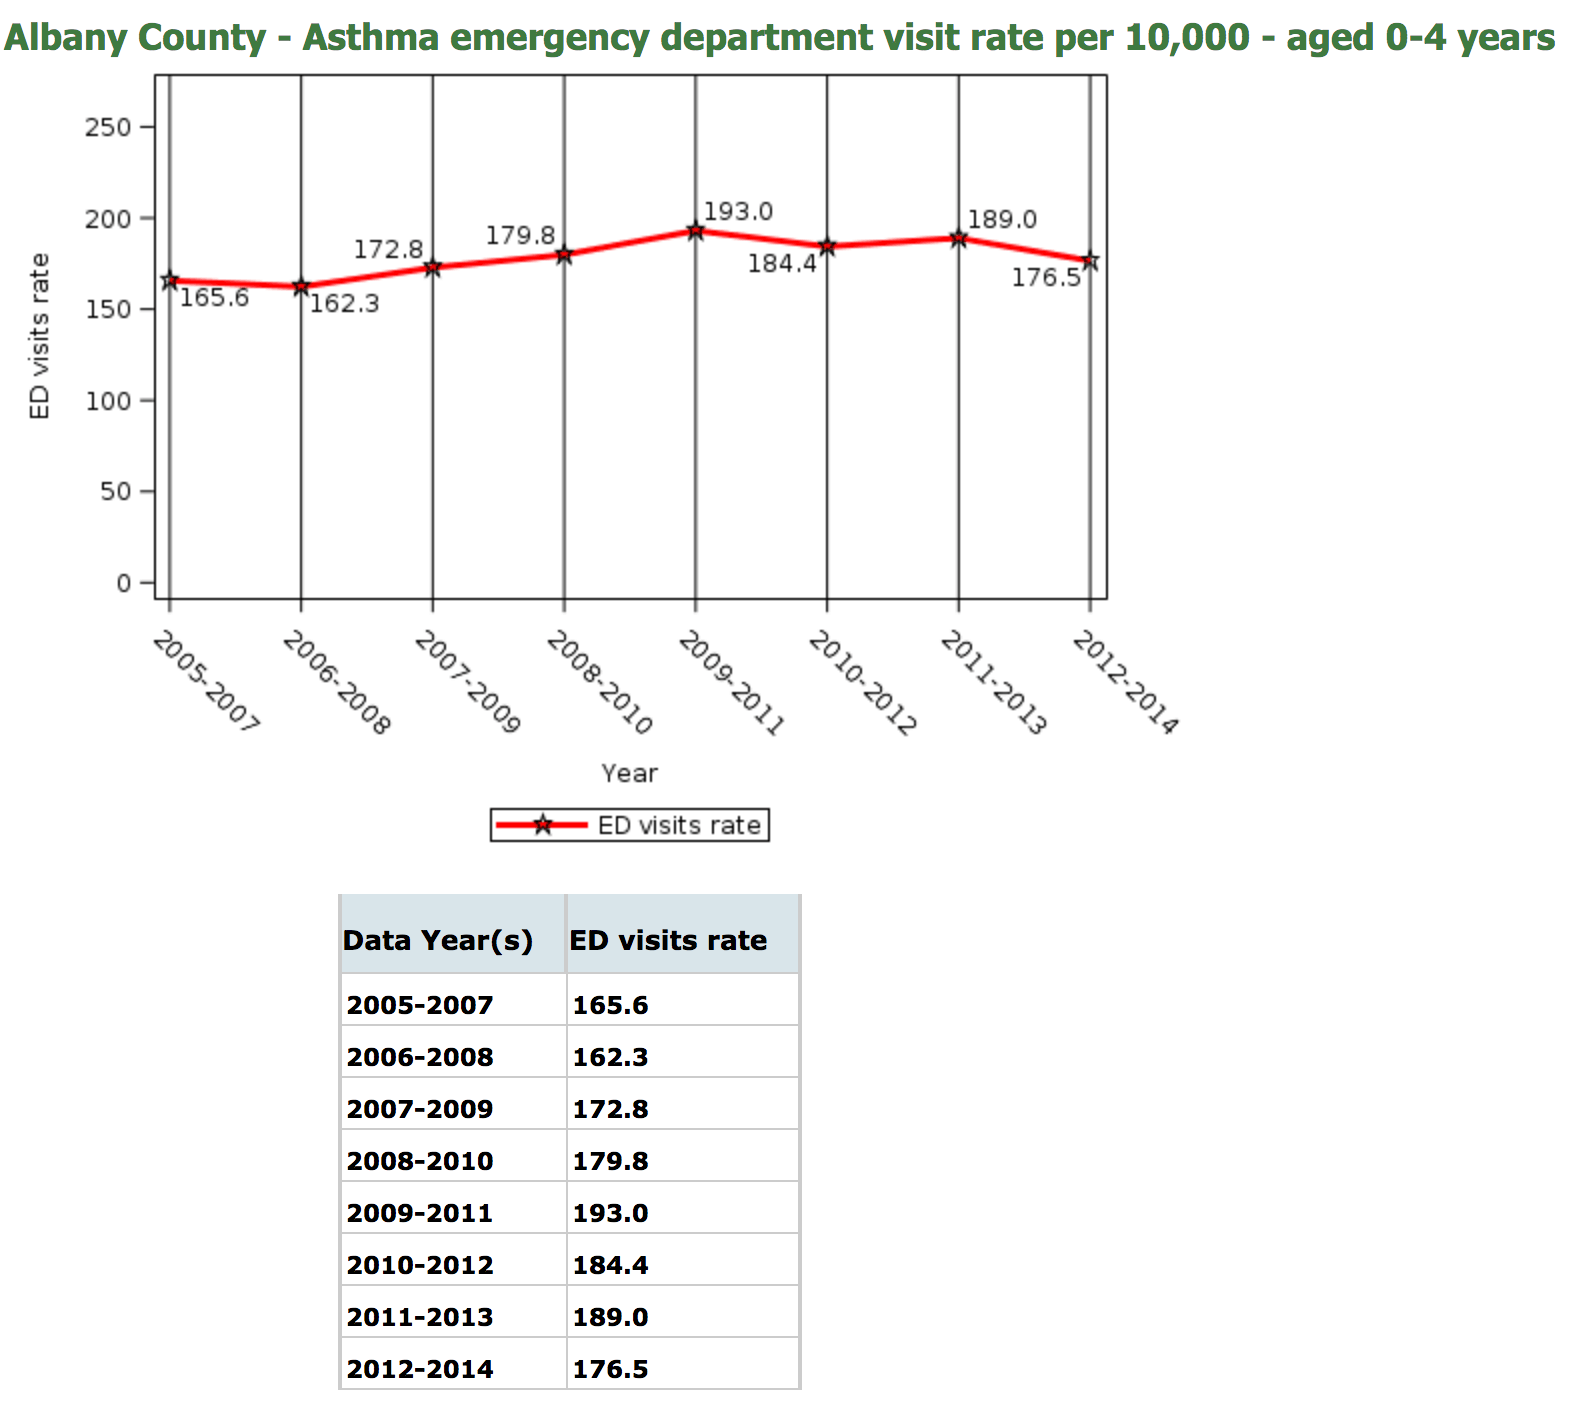
What I really wanted though was a single table with each county
I used rvest to obtain the data and defined a function, read_asthma_dat(), to parse the HTML from the website.
u <- "https://webbi1.health.ny.gov/SASStoredProcess/guest?_program=/EBI/PHIG/apps/asthma_dashboard/ad_dashboard&p=ctr&ind_id=ad8%20&cos="

read_asthma_dat <- function(u){
  p <- read_html(u)
  p2 <- p %>% html_nodes("body #main #content div div#dashboard h2 div.branch div div table.data_table")
  p3 <- p2 %>% html_table()
  h <- p %>%
    html_nodes("body #main #content div div#dashboard h2") %>%
    html_text() %>%
    str_split("years") %>%
    {.[[1]][1]}
  names(p3) <- h  #name the list
  return(p3)
}
Then, I collected the data (pg_list) as a list of data frames with each data frame corresponding to a different county. There are 62 counties in NYS, so the length of pg_list is 62.
max_pg <- 62 # this is the # of counties in NYS
pg_list <- vector("list", max_pg) #set up an empty list of length `max_pg`

for(i in 1:max_pg){
  u <- paste0(u, i)
  asth_dat <- read_asthma_dat(u)
  pg_list[[i]] <- asth_dat
  Sys.sleep(time <- rbeta(1,1,1) + 1) #don't overwhelm the NYS server with requests
}

#saveRDS(pg_list, file = here("static", "data", "asthma_by_county.rds"))
Create a data frame from the list of tables
Then, I used dplyr and reshape2 to convert the list of data frames to a tibble (similar to a data frame).
pg_list <- readRDS(file = here("static", "data", "asthma_by_county.rds"))

asthma_list_to_df <- function(pg_list){
  pg_list %>%
  reshape2::melt() %>%
  select(-L1) %>%
  clean_names() %>%
  as_tibble() %>%
  mutate(years_num = as.numeric(as.factor(data_year_s))) %>%
  rename(years = data_year_s) %>%
  mutate(county = str_split(l2, pattern = " - ") %>%
           map(.f = ~.[[1]]) %>%
           unlist ) %>%
  mutate(county_colors = ifelse(county == "Bronx County", "green", "red"),
         years = factor(years, ordered=TRUE))
}

pg_list.m <- asthma_list_to_df(pg_list)
Plot the ER data
Now, we can use pg_list.m to create a visual of the data.
asthma_plot <- function(dat){
  g <- ggplot(dat, aes(x=years, y = value, col = county_colors)) +
  geom_line(aes(group = county, col = county_colors)) +
  geom_point() +
  scale_color_brewer(palette = "Paired", direction = -1,
                     labels=c("Bronx county", "61 other NYS counties")) +
  ylab("Number of ER visits per 10,000 people") +
  xlab("Years") +
  labs(color = "County") +
    theme(axis.text.x = element_text(angle = 90, hjust = 1),
        legend.title=element_blank())
  #print(g)
  return(g)
}
asthma_plot(pg_list.m) + ggtitle("Asthma-related Adult (18-64 yo) ER Visits in New York State") 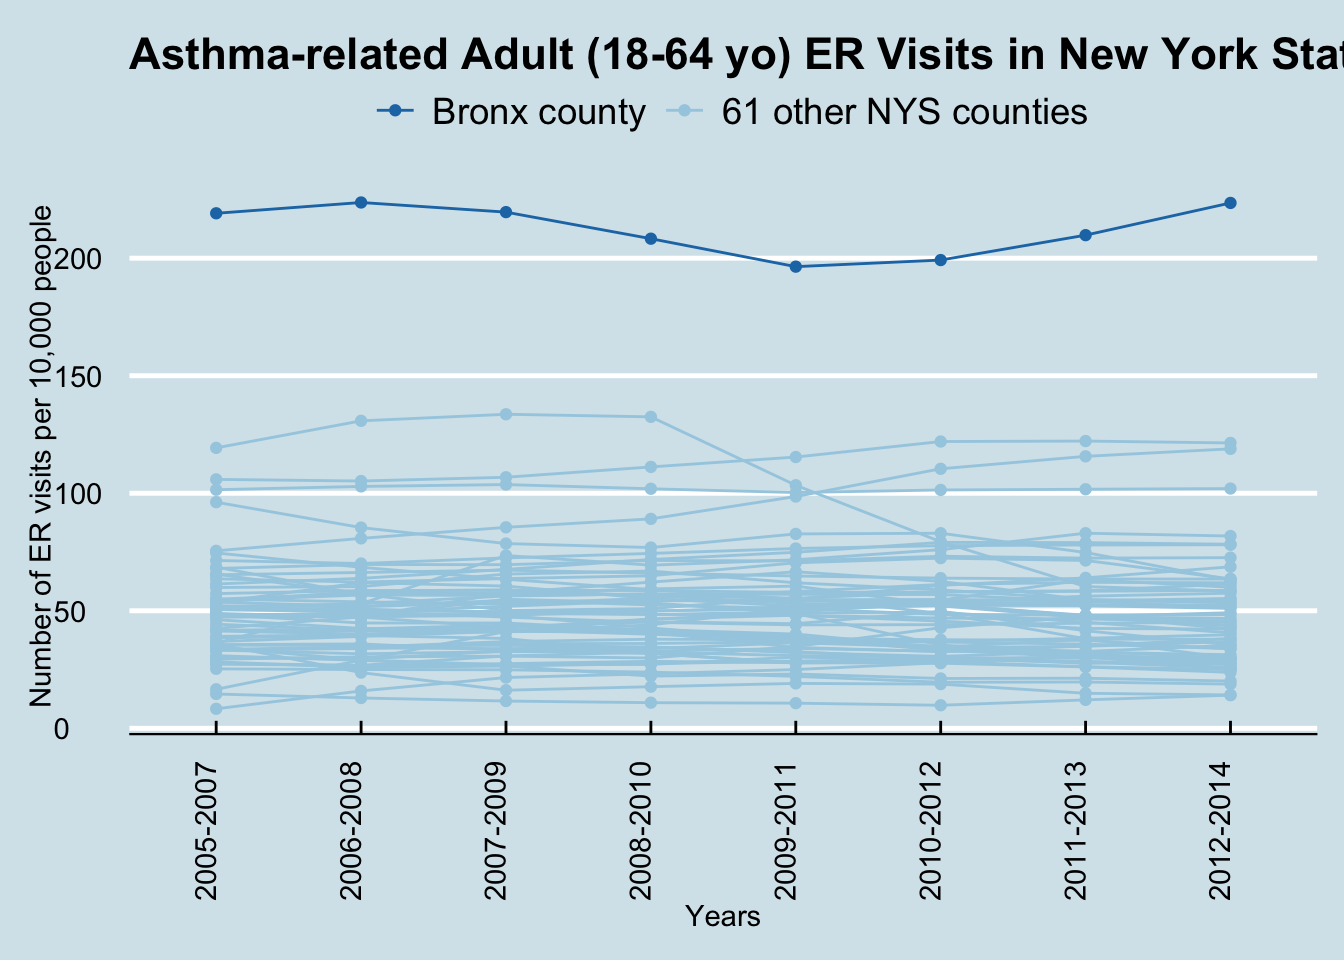
We can see that the rates of asthma in the Bronx are by far the highest out of any county in NY state. But exactly how much higher?
mean_asth_visit_bx <- pg_list.m %>% filter(county == "Bronx County") %>% summarise(mean(value))
mean_asth_visit_nonbx <- pg_list.m %>% filter(county != "Bronx County") %>% summarise(mean(value))
mean_asth_visit_nyc <- pg_list.m %>% filter(county %in% paste0(c("Bronx", "Queens", "New York", "Kings"), " County")) %>% summarise(mean(value))

mean_asth_visit_bx #average rate in the Bronx across all years
## # A tibble: 1 x 1
## `mean(value)`
## <dbl>
## 1 212.mean_asth_visit_nyc #average rate in NYC across all years## # A tibble: 1 x 1
## `mean(value)`
## <dbl>
## 1 121.mean_asth_visit_nonbx #average rate in all other counties across all years## # A tibble: 1 x 1
## `mean(value)`
## <dbl>
## 1 49.2fold_diff_bx_nonbx <- mean_asth_visit_bx/mean_asth_visit_nonbx #fold difference
fold_diff_bx_nyc <- mean_asth_visit_bx/mean_asth_visit_nyc #fold differenceER visits for adults age 18-64 with asthma in the Bronx are 4.3x as high as the rate in other counties in NY State, and 1.7x as high relative to other counties in NYC.
We can also look at the same stats for children.
u2 <- "https://webbi1.health.ny.gov/SASStoredProcess/guest?_program=%2FEBI%2FPHIG%2Fapps%2Fasthma_dashboard%2Fad_dashboard&p=ctr&ind_id=ad1&cos="

max_pg <- 62 # this is the # of counties in NYS
pg_list2 <- vector("list", max_pg) #set up an empty list of length `max_pg`

for(i in 1:max_pg){
  u <- paste0(u2, i)
  asth_dat <- read_asthma_dat(u)
  pg_list2[[i]] <- asth_dat
  Sys.sleep(time <- rbeta(1,1,1) + 1) #don't overwhelm the NYS server with requests
}

#saveRDS(pg_list2, file = here("static", "data", "asthma_by_county_age0_4.rds"))
Plot the data for children ages 0-4
pg_list2 <- readRDS(file = here("static", "data", "asthma_by_county_age0_4.rds"))

pg_list2.m <- asthma_list_to_df(pg_list2) %>%
  mutate(value = ifelse(is.na(value), ed_visits_rate, value) %>% as.numeric) %>%
  select(-ed_visits_rate)
asthma_plot(pg_list2.m) + ggtitle("Asthma-related Child (0-4 yo) ER Visits in New York State") 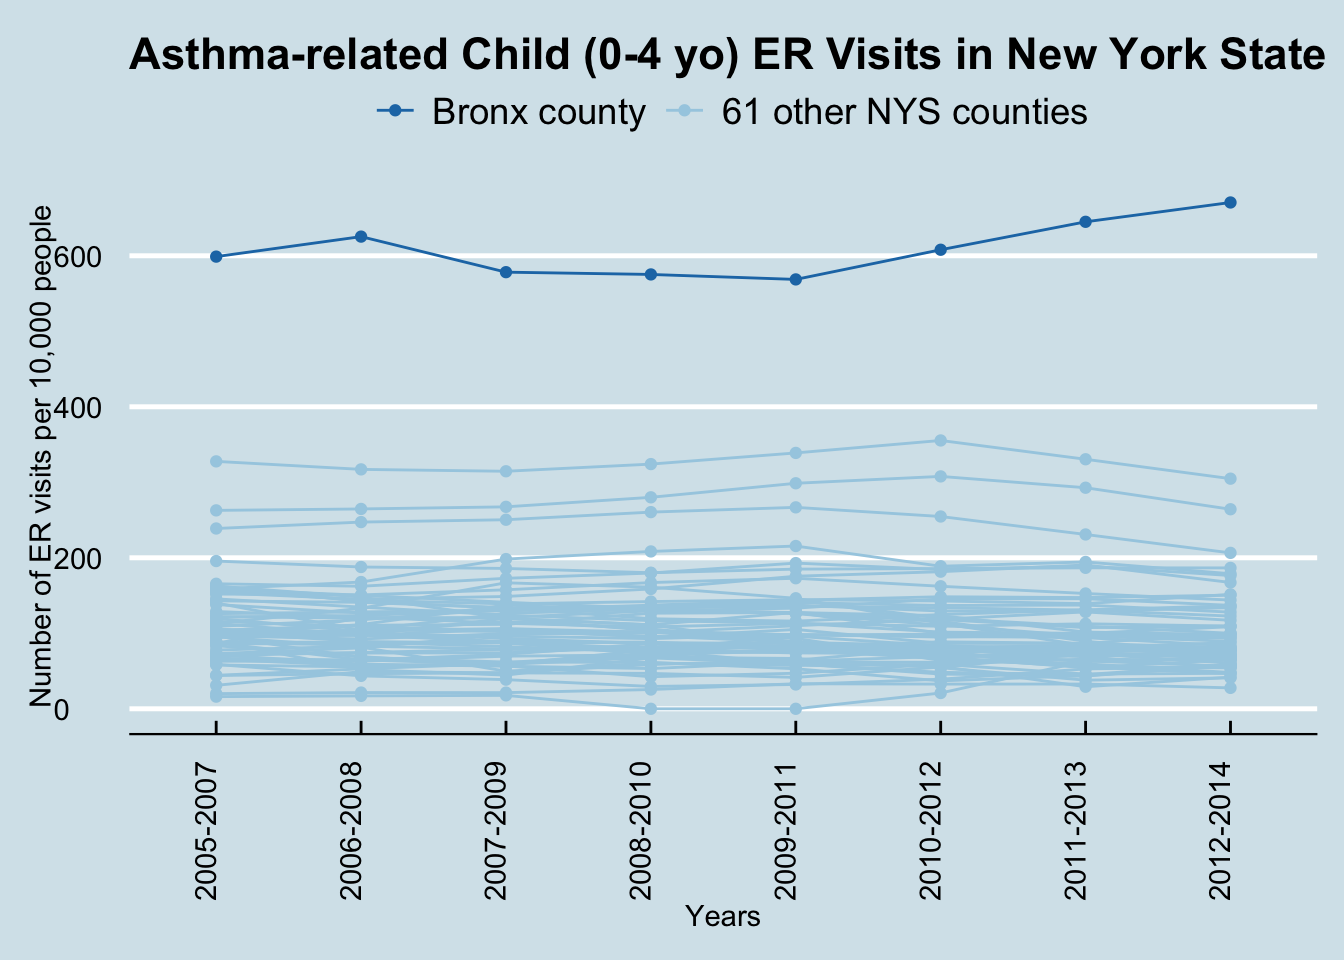
We need more research to figure out exactly why the asthma ER visit rates are so high in the Bronx (e.g. worse levels of pollution, decreased access to asthma medication, medication compliance, etc.) and what we can do to lower these rates for the Bronx’s 1.4 million residents.
Here’s a link to some additional posts that discuss the issue of asthma in the Bronx in both adults and children:
https://medium.com/asthma-in-the-south-bronx/asthma-by-the-numbers-73553b2c9621
https://www.nytimes.com/1995/09/05/us/asthma-common-and-on-rise-in-the-crowded-south-bronx.html
-Daniel